Invest in the Future: Örebro's mobility models
The Municipality of Örebro is finding new ways to set mobility targets and map out action for change. Per Elvingson finds out how computer modelling of a new rapid bus service is helping the POLIS member city to realise its mobility goals.
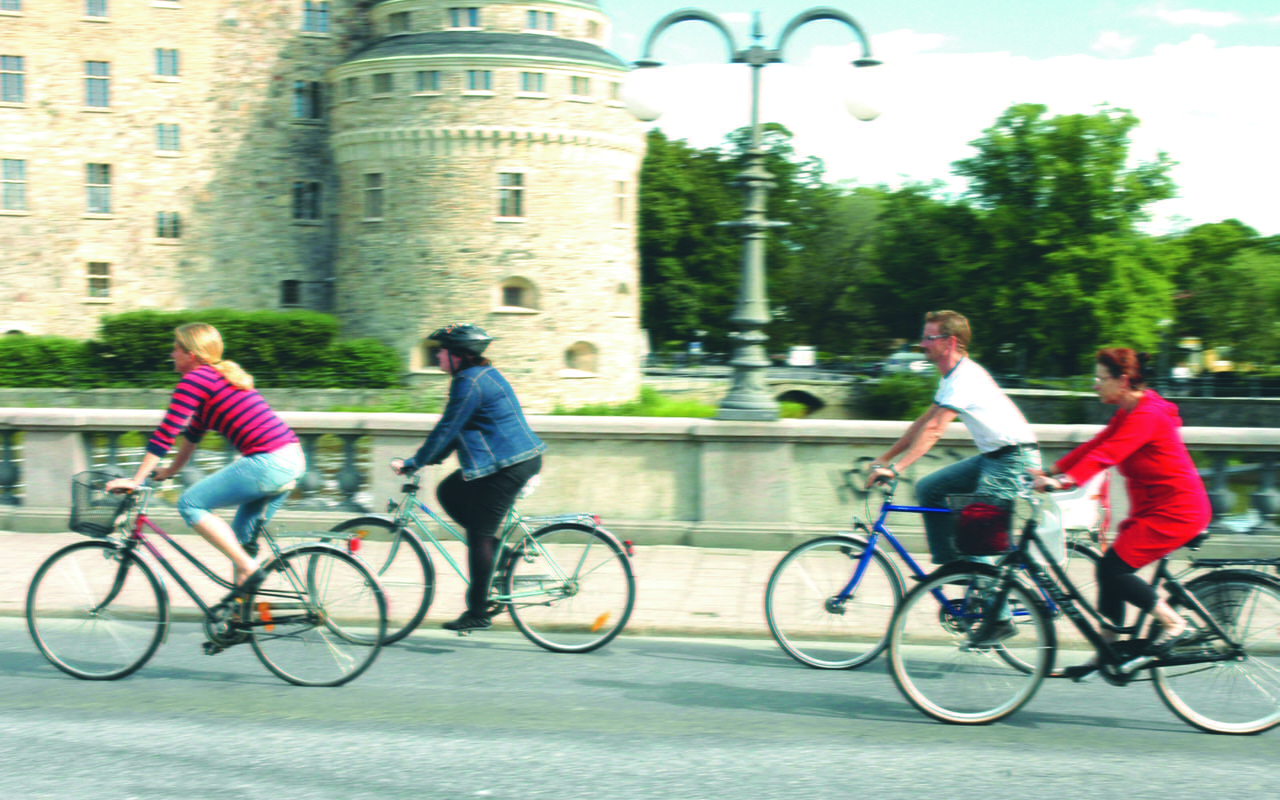
The current Mobility Plan of the hub aims to achieve 60% of trips using sustainable travel (walking, cycling, public transport) by the end of this year. With the share at 50% in 2017 and around 25% of all trips made by bike ,(making Örebro one of Sweden’s leading cycling cities), the target is well within the municipality’s sights.
Many measures have been implemented in the municipality over the last few years to help achieve these sustainability targets. Infrastructural improvements and public awareness campaigns encouraging walking, cycling and public transport have been at the core of this effort; however, travel habits have been tough to shift.
Additional and more comprehensive actions are required to change Örebro's modal split. At present, it is easy and relatively cheap to drive to and park in central parts of the city; meanwhile, better bicycle lanes and more frequent buses do not yet provide sufficient incentive to get drivers out of their car and onto the saddle.

The modal split today and after different interventions, using the generalised costs model, © POLIS Network internal stock
Örebro is Sweden’s seventh largest municipality. The 750-year-old city is home to 143.000 people, 16% of which have a background outside Sweden, thus representing 165 different nationalities. Örebro is a university city and a logistics hub with good access to national road and rail networks. In 2008, Örebro established a Sustainable Urban Mobility Plan, and a revised SUMP for the city was adopted in 2014. The still ongoing plan includes objectives and general principles for traffic in the city, and serves as an umbrella for a cycling strategy, a parking policy and a programme to combat noise pollution.
It is the year 2040...
 This is where visionary modelling comes in. In order to inform politicians, mobility industry representatives and residents about potential transport developments, Örebro is using a traffic modelling software, VISUM, to forecast the municipality’s mobility status in 2040. When using the model, it is assumed that current population trends will continue, leading to an increase in the number of inhabitants by as much as one third (+50,000 people) in the next 20 years. Additionally, the model presents and estimate of the distribution of all new inhabitants and workplaces in line with the municipality’s plan for spatial development. If current modal split continues into 2040, the number of car trips will increase proportional to the population. The result is not aesthetically pleasing. The VISUM traffic model shows severe congestion and an unattractive urban environment both for inhabitants and visitors. It is also calculated that due to projected population rise, even if current SUMP targets are met, the number of car trips after 2040 will exceed 2020’s figures.
Unfortunately, as illustrated by a modelling exercise carried out by consultant Urbanet Analyse, the BRT alone does not put Örebro on track to reach the SUMP targets. This model investigated the change in generalised costs for individual travellers and, according to this model, the BRT system will result in shorter travel times for bus passengers, yet only marginally extending car travel time, which will move a proportion of car drivers to public transport, but not a sufficient number to trigger comprehensive changes in Örebro’s modal split.
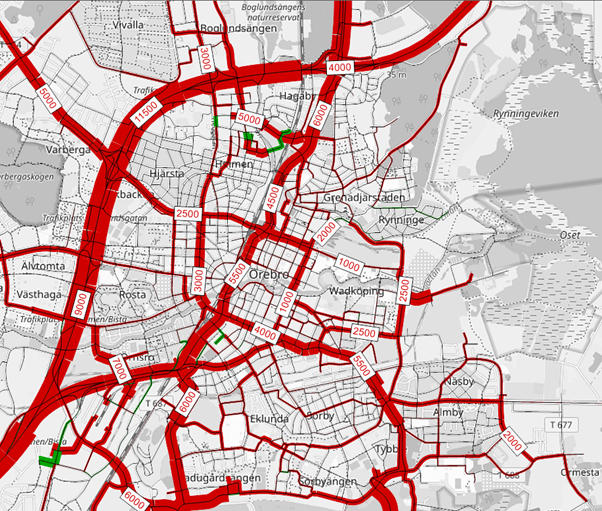
Simulated increase in number of cars in the central parts of Örebro by 2040 in the business-as-usual scenario, according to the VISUM model. Figures in the map represents number of additional cars per day, © Örebro Municipality
When more changes affecting the generalised cost are fed into the model, the effect on travel habits also increases. This therefore suggests that the BRT promises more sustainable travel/transport, but that the effect will be much higher when combined with with lower fares in public transport, further improvements in the city bus network, and a doubling of the current car parking charges in the city centre and at the university.
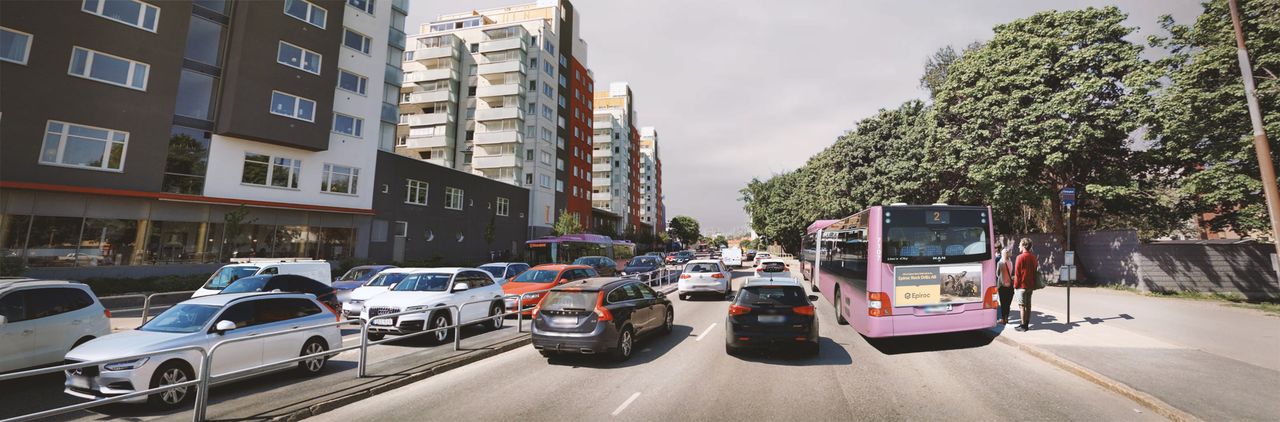
Visualisation of estimated traffic situation on Rudbecksgatan, one of the main roads leading into the city centre, by 2040, © Örebro Municipality
However, it appears even these interventions are not enough to reach the SUMP targets. The main conclusion from modelling of generalised costs is that extensive mobility measures must be implemented for tangible change in travel habits, a feat such modelling discussed here can help achieve.
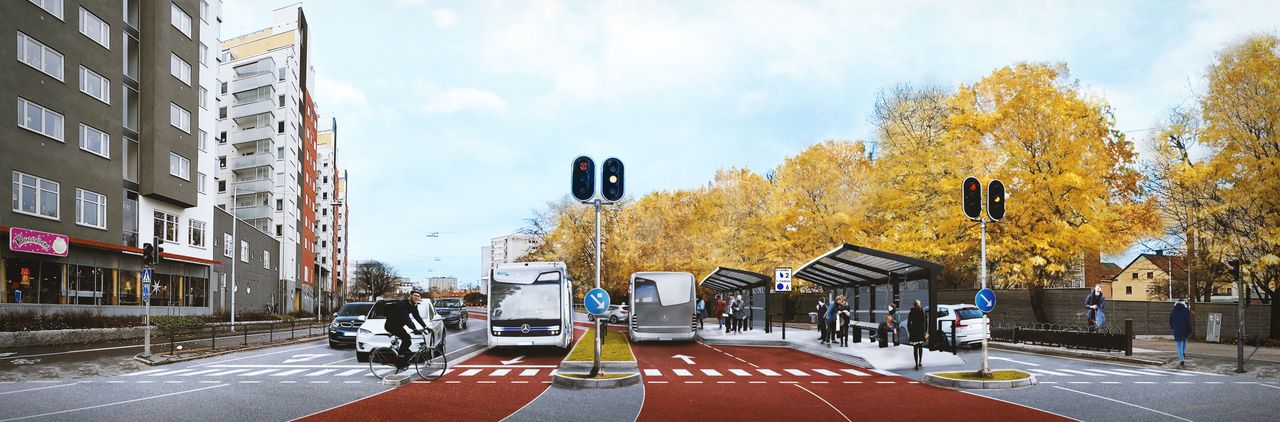
Visualisation of Rudbecksgatan in year 2040, with BRT system in place, © POLIS Network internal stock
PTV Visum is a software package for traffic analyses, forecasts and GIS-based data management on city, regional or national levels. It consistently models all transport modes and their interactions in a unified network data model. Sophisticated tools for management, import/export and editing of network elements, traffic demand and related datasets allow to efficiently build up large transport models.
 PTV Visum is a software package for traffic analyses, forecasts and GIS-based data management on city, regional or national levels. It consistently models all transport modes and their interactions in a unified network data model. Sophisticated tools for management, import/export and editing of network elements, traffic demand and related datasets allow to efficiently build up large transport models.