Absolute zero
The benchmarking of road safety in cities has rarely been more timely says Alexandre Santacreu
"What can we learn about the relative safety of each mode of transport, including the impact of one mode on the safety of others?"
Which cities have the best road safety performance? Which indicators are most relevant in assessing performance or setting targets? Are figures comparable across cities? Which road safety challenges are specific to cities? Answering these questions will determine the policy responses which can help cities deliver their Vision Zero ambitions.
As readers of this magazine are aware, local governments are working hard to develop sustainable mobility solutions, seeking to shift people from their private vehicles to other modes. What is the impact of mode shift on road safety? If cycling is more dangerous than travelling by car, is there still a case to encourage a shift? When confronted with road network congestion, numbers of city dwellers choose to travel by powered two-wheelers (P2W). What is the impact on road safety? What can we learn about the relative safety of each mode, including the impact of one mode on the safety of others?
With this in mind, the International Transport Forum (ITF) is collecting data and hosting expert meetings at both national- and city-levels, with the International Road Traffic Safety Data and Analysis Group (IRTAD) and the Safer City Streets network respectively.
Members of the Safer City Streets network met in Paris, Brussels and Rome, jointly with members of the Polis road safety working group. Building on these exchanges, the ITF has just published a working document: Safer City Streets Global Benchmarking for Urban Road Safety.
This article reports on some aspects of the ITF publication, and focuses on the impact of mode shift on traffic fatalities.
TRAFFIC FATALITIES IN CITIES
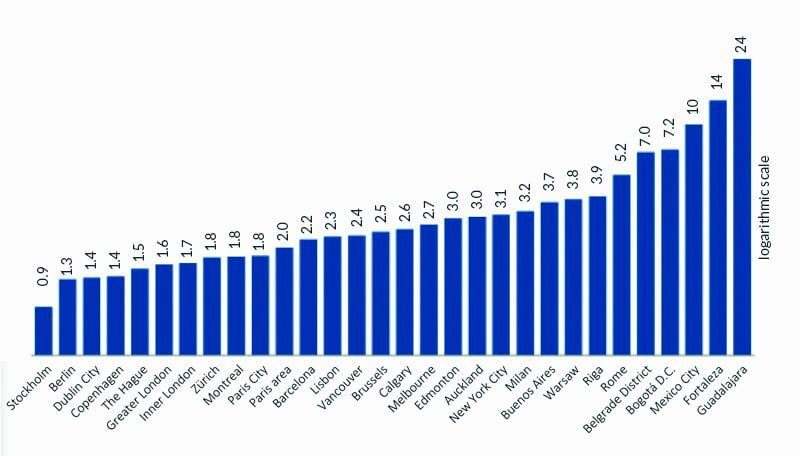
The most common road safety indicator is the number of road fatalities per unit population, also called road mortality. The ITF benchmark reveals a wide range of situations, with figures ranging from 0.9 to 24 fatalities per 100,000 population per year. Needless to say much progress can be made in most cities.
URBAN TRAFFIC CASUALTIES BY USER GROUPS
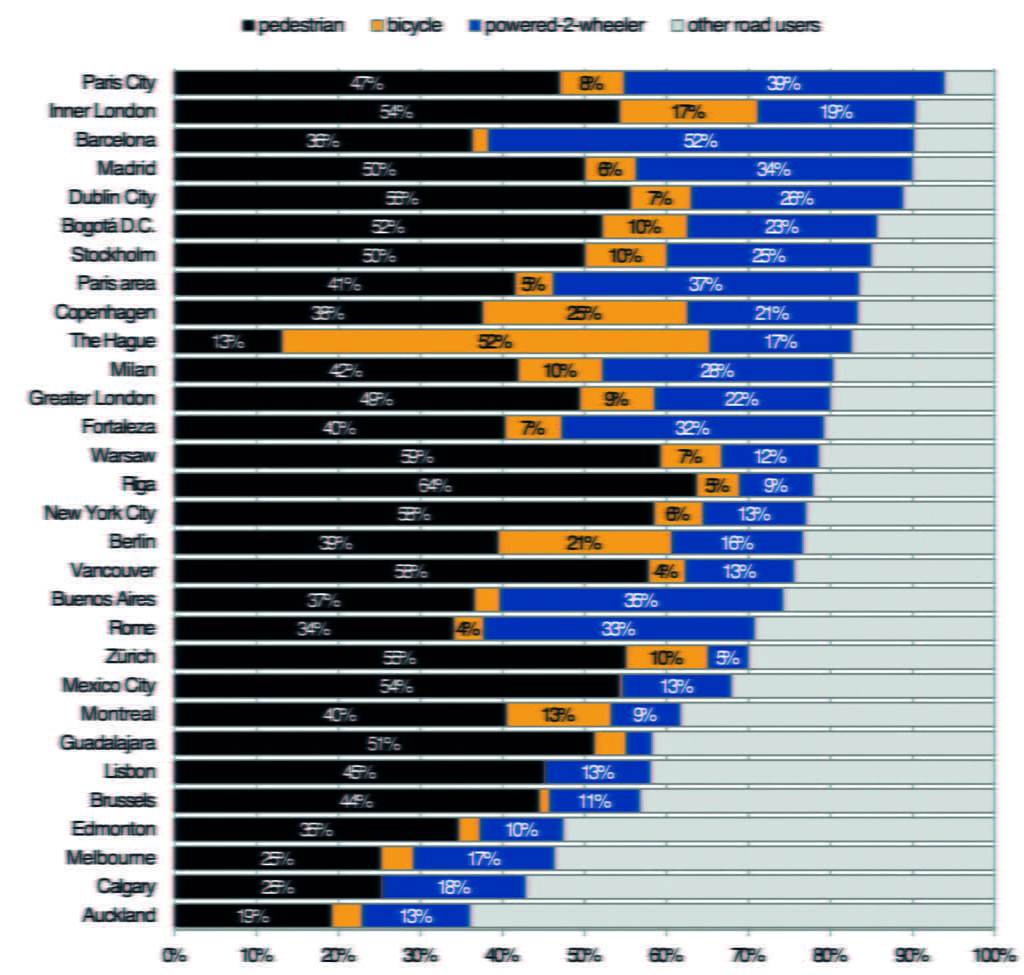
Vulnerable road users (VRUs) typically make up four in 10 fatalities in national-level statistics, according to the ITF IRTAD database. In cities, however, VRUs typically make up eight in 10 fatalities. This is a considerable difference which makes the protection of VRUs an absolute priority in cities.
FATALITY RISK BY TRANSPORT MODE
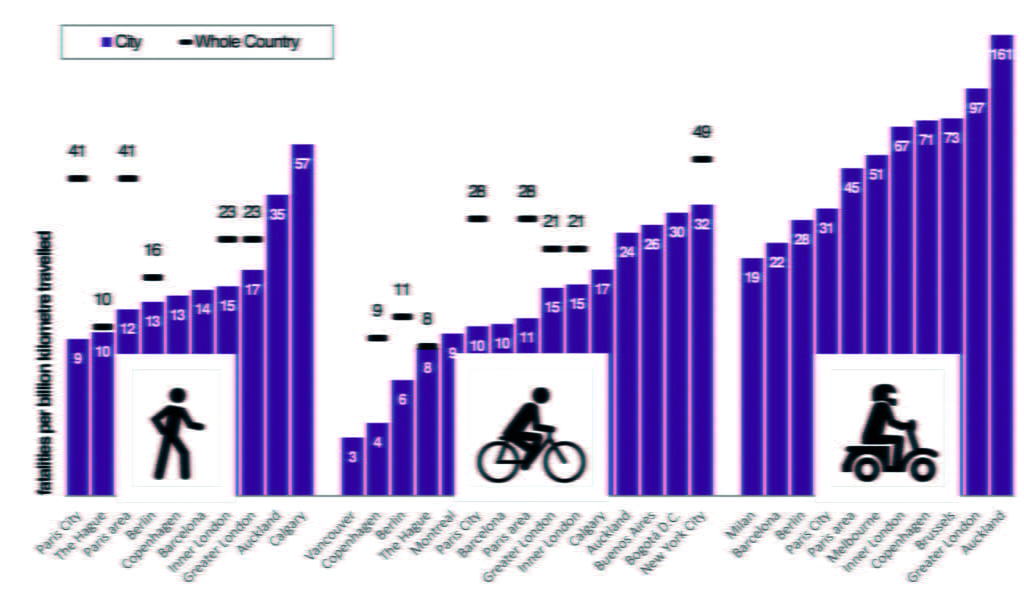
To measure the level of risk experienced by each road user group, the ITF measured the probability of being killed in a collision, for each unit of distance travelled. Here again, the benchmark reveals large variations in risk across cities. The risk experienced by pedestrians varies six-fold. The risk of being killed on a bicycle varies 10-fold. Such information is precious to help cities learn from their peers.
Differences observed across cities reflect, to some extent, the differences already observed across countries. Indeed, at national level, cycling risk figures between eight and 51 fatalities per billion kilometres cycled were reported in the ITF 2018 Cycling Safety Roundtable.
Results also highlight that cycling is not as dangerous as people often think it is. In the majority of cities, it seems to be safer to travel one kilometre on a bicycle than on foot. This may no longer be true if serious injuries were included in the performance indicator. The comparability of serious injuries across cities and countries is a significant challenge, as discussed further down.
Can we compare the safety of different travel modes? To do so, the ITF assembled a comprehensive dataset covering five modes of transport in five cities: ● The risk of fatality is four times higher when riding a powered two-wheeler than when riding a pedal cycle over the same distance;
● The risk of fatality is 10 times higher on foot than in a passenger car travelling the same distance;
● Travelling on board a bus is an order of magnitude safer than all other modes of travel. What interpretation could be made of such results by policy makers? Certainly that developing public transport is one of the keys to reducing road fatalities. Would there be a case to promote the use of private cars in cities, replacing some walkable or cyclable trips by car trips, on road safety grounds? This would be overlooking the risk imposed by motorised road users on other user groups, not to mention wider public health impacts.
FATALITY RISK IMPOSED ON THIRD-PARTIES
Occupants of private cars, vans, trucks and buses are remarkably well protected from the risk of being killed in traffic. On the other hand, they contribute to a significant risk for vulnerable road users (VRUs), such as pedestrians, to be killed in collisions with cars.
The goal is not to attribute responsibilities or blame a particular user group, but to give an indication of the road safety benefits in the event of mode shift. Without such calculations of “third party risk”, one couldn’t estimate the road safety impact of mode shift.
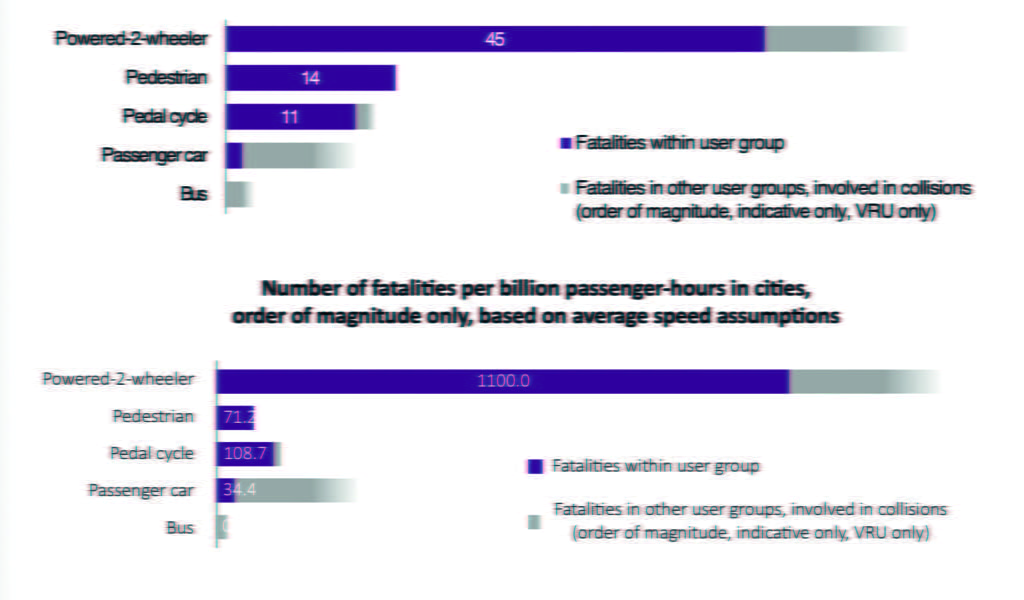
Using data from Bogota, Paris and Inner London, a first estimation can be made of the number of third party fatalities among VRUs. It is now possible to visualise the risk of being killed in traffic combined with the risk of causing fatalities among vulnerable road users. In these two components of risk, the latter has yet to be investigated in a greater number of cities and can only be seen as an order of magnitude – hence pictured as blurred.
Nevertheless, looking at the combined risk imposed onto oneself and onto others, it seems that bus travel has by far the lowest impact in terms of fatalities. At the other end of the spectrum, the use of a powered two-wheeler has by far the greatest impact, about 20-times greater than that of bus travel. If risk was presented by unit time, rather than distance, the risk associated with P2W would be 50 times higher than the risk associated with bus travel.
Risk by unit time couldn’t yet be computed using the Safer City Streets database which only contains trips and distance information. To better estimate the road safety impacts of mode shift, the ITF will seek to collect passenger-hours data in the future.
SERIOUS TRAFFIC INJURIES
Due to inconsistent definitions and due to under-reporting, in the absence of hospital data, injury figures are not yet comparable across cities. This is why city-level road safety performance analysis is limited to fatalities. This choice affects the quality of the analysis in two ways:
1) Much could be learned from injuries, as they don’t necessarily follow the same pattern as fatalities;
2) Much statistical significance is lost due to the natural fluctuations of small numbers.
The ITF encourages local and national governments to further engage in the collection of robust and comparable injury data. Several methods exist, typically based on hospital admission data, many of which are documented by ITF, FERSI and SafetyCube. Where hospital data is not available, a survey of the population can produce an estimate of the true number of injuries, whether or not they are reported to the police. As it is the case in England, such a survey could be integrated to a permanent travel survey.
About Safer City Streets
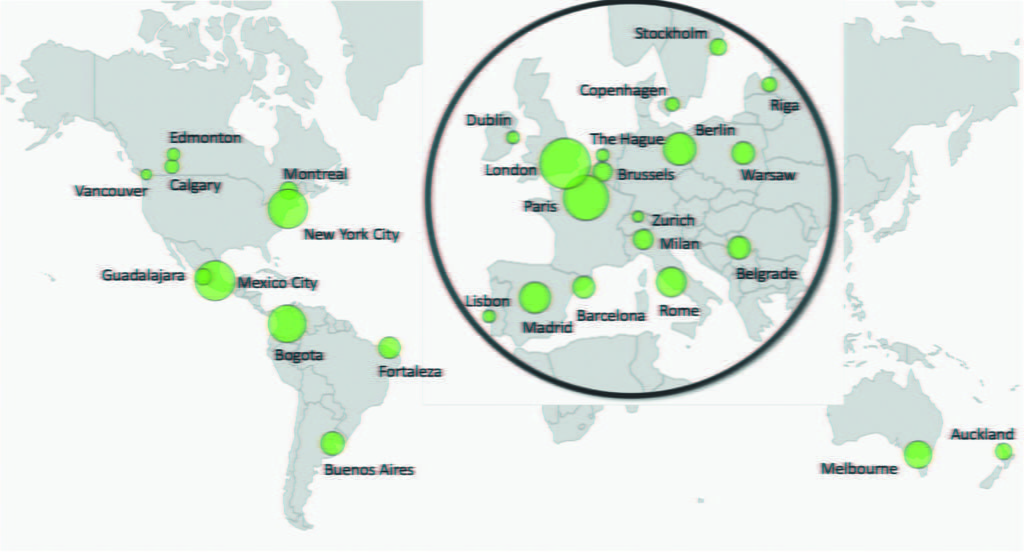
Safer City Streets is the global traffic safety network for liveable cities. In the network, cities improve their urban road safety performance by sharing data, experiences and knowledge – by learning from each other. Since the official launch of the initiative at the UN conference Habitat III in 2016, more than 40 cities have joined the network. Safer City Streets is funded through the FIA Road Safety Grant Programme and managed by the International Transport Forum (ITF), which collects, validates and analyses data on urban casualties, mobility, traffic and behaviours provided by cities. The ITF is an intergovernmental organisation with 59 member countries. It acts as a think tank for transport policy and organises the Annual Summit of transport ministers. The Safer City Streets network is open for more cities to join. To express your interest and learn more, please contact Alexandre Santacreu and visit the ITF website at www.itf-oecd.org.
WHAT’S NEXT?
With the publication of this benchmarking report, the ITF seeks to raise the bar in urban road safety, specifically in outcome surveillance. In other words, the idea is to help cities collect relevant and comparable data, giving them a platform where to compare their performance with their peers. The idea is also to create a network of experts, helping make a robust interpretation of the data.
The analysis of road safety performance in cities wouldn’t be complete without a review of road safety strategies, action plans, budgets and governance arrangements. Nevertheless, much can be learned already from the analysis of road safety indicators focused on outcomes, i.e. casualties.
Further investigation will be needed to untangle the relationships between urban shape, density, speeds, mode share and road user risk. Gender and social aspects of road safety should also be examined. This will require not only good casualty data sources, but also good data on trips, most likely from household surveys.