The People Have Spoken: Citizen science and mobility
The City of Leuven’s Kris Vanherle and Wouter Florizoone share insights on the mobility impact of the COVID-19 pandemic from an unexpected and fairly new data-source: Citizen Science!
These measures include the closure of schools, businesses, shops, parks, public services in varying degrees. Obviously, as people were forced to stay indoors, these measures have had a big impact on mobility, not in the least in cities. There are various efforts ongoing to estimate the exact effect the COVID measures have had and are having on our mobility. We will demonstrate that citizen science data can offer robust additional insights at low cost.
Thanks to technology, we have a unique, near real-time view on the mobility impact of COVID-19, providing new and unique insight into our mobility behavior. Google1and Apple2 have set up projects to track mobility impact, based on data collected from operating systems of mobile devices. Findings from Google include a reduction of 64% traffic in transit stations and 25% increase of staying at home, in Belgium.
Similarly, Apple estimates the reduction in driving of about 53% and 63% of walking in the city of Brussels. Continuous traffic monitoring systems with camera systems or inductive loops also provide insight in total traffic volumes. In Belgium, the continuous monitoring system has seen a drop in about 20% of freight and 55% of passenger traffic on highways. Can citizen science provide any additional insights to these impressive analytics? We argue it most definitely can!
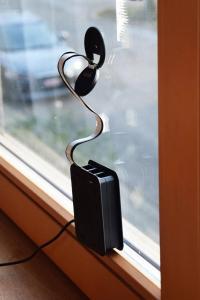
In 2019 in Leuven a citizen science pilot project Telraam was set up to collect traffic data. Telraam relies on a low-cost, camera-based automated sensor. These devices are unique in the sense that citizens play a key-role in the data-collection process. The devices are installed by a private citizen on a window and need to be connected to a power supply and the home W-Fi-network to send data to the central platform.
 In 2019 in Leuven a citizen science pilot project
By using standard hardware (Raspberry Pi) and the connectivity and power supply of participating citizens, the cost of the data collection is strongly reduced compared to traditional techniques, allowing for a large network of counting points, much more dense than existing traffic counting technologies. Moreover, Telraam devices are able to distinguish between modes of traffic passing by: cars, cyclists, pedestrians and heavy vehicles, and can also give an indication of the speed of cars. Though the system has limitations, the output is of sufficient quality to detect trends in the mobility patterns.
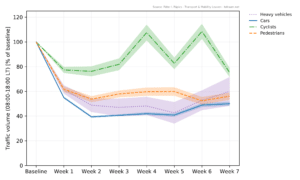
As of early March 2020, about 800 Telraam devices have been deployed in the field, mostly in cities in Belgium (Leuven, Ghent, Brussels, Antwerp) of which about 550 were actively and continuously collecting data during March-April, at the peak of the COVID-19 pandemic. Transport & Mobility Leuven; the developer of the Telraam project, has set up a “COVID-19-tracker”, tracking mobility patterns on a weekly basis. The methodology is fairly straightforward, comparing total traffic volume by mode, for the same time-interval and for the same devices in the entire network, normalized to a typical pre-Corona week. Weekly intervals are as follows:
 Baseline: 2020/03/02 to 2020/03/08
Week 1: 2020/03/16 to 2020/03/22
Week 2: 2020/03/23 to 2020/03/29
Week 3: 2020/03/30 to 2020/04/05
Week 4: 2020/04/06 to 2020/04/12
Week 5: 2020/04/13 to 2020/04/19
Week 6: 2020/04/20 to 2020/04/26
Week 7: 2020/04/27 to 2020/05/03
We can observe some interesting trends. First of all, total traffic reductions are well in line with findings of any other mobility tracker, roughly about 50-60% reduction of mobility. In Belgium, all measures were implemented on March 18 (at midday), which explains the limited reduction in the first week. The traffic reductions are relatively stable starting week two, with a few outliers. We observe significant differences between modes. Car traffic was reduced by about 60%, large vehicles (combination of trucks and buses) about 50%, pedestrian traffic about 45%, yet bicycle traffic only lost about 20% of traffic in the first weeks. This is a significant difference compared to other modes. It is likely that mostly commuting traffic, which is dominated by car, has been most affected by the measures, while bike-trips, which are typically shorter (e.g. for shopping in nearby grocery stores and pharmacies) have been less affected.
In addition, as citizens in Belgium were encouraged to still undertake physical exercise, we suspect an increase in recreational cycling as well. The hypothesis of the increase of recreational cycling is further supported by the strong increase in cyclists in week four and week six, both of which had exceptionally good weather, while in week five it rained. Bicycle traffic in both weeks four and six was actually about 7% above typical pre-corona levels. These specific observations for cyclists are quite remarkable and remain undetected by most other COVID mobility trackers, which are either car-oriented or mode-unspecific. Furthermore, it is worth pointing out that while cyclists have increased, pedestrian traffic has stayed more or less constant throughout.
The Telraam-platform also reveals striking differences between different locations. Some road segments saw an increase of bike traffic up to a factor of two compared to pre-corona levels, creating new problems in terms of respecting social distancing. Telraam also reveals that the reduction of car traffic volume is leading to increased speeding in some locations. Though this may seem counterintuitive, the reduction of car traffic basically allows the remaining cars to drive faster. This is especially true on road segments inside city centres where congestion in pre-corona times guaranteed low car speeds and speeding is a new phenomenon. The increase of speeding is raising new safety concerns, in particular for cyclists who - due to the limited public space - are sharing the same road surface with cars.

Map of traffic count taken from Telraam
Unparalleled insight
Keeping in mind that most Telraam devices (+/- 65%) are deployed in cities, these fine granular details, up to hourly resolution and on road-segment level, provide valuable insights for local authorities to design a suitable mobility policy strategy to respond to the COVID-crisis and possible new lockdowns in the future. In a world where physical distancing will be the new norm for the foreseeable future, it is important to allow cyclists to bike safely and respect social distancing directives. As such, shifting scarce use of public space from cars to cyclists, as is done in various cities in the world, is a viable and future-oriented strategy, supported by evidence from traffic volumes. Moreover, there are many objective living and housing data from which it can be concluded that it is important to stimulate active road use as much as possible in function to the physical, social and psychological well-being of citizens who have limited space at home in an urban environment.
What the Telraam COVID-tracker teaches us is that citizen science can indeed provide valuable evidence to local authorities to build a policy response. Moreover, the technology can be used worldwide. This year, the cities of Madrid, Cardiff, Ljubljana and Dublin will deploy Telraam networks, in the scope of the H2020 project Citizens Observing UrbaN Transport (WeCount3). Projects like Telraam and WeCount are proving that citizen science is not just a gimmick but is indeed able to generate evidence at lower cost, providing localized qualitative insights that traditional tools and Big Tech can’t provide.
Let us hope that one of the lasting long-term impacts of the COVID-crisis is an awareness with local policy makers and the transport research community about an emerging, promising new traffic data stream, coming from an unexpected source: The Citizen!
Author: Kris Vanherle is a researcher at Transport & Mobility Leuven and Wouter Florizoone is a project & product development manager at Transport & Mobility Leuven
![]()
Telraam is a sensor and platform to support traffic counting in a citzen science setting. The sensor is based on a Raspberry Pi microcomputer and a low-resolution camera. Telraam sensors are mounted on the inside of an upper-floor window with a view over the street. All the counting data is collected on the platform (www.telraam.net). Images are processed instantaneously on site and no privacy-sensitive information is transferred to the servers

WeCount is an H2020 project under the SwafS-program. WeCount aims to empower citizens to take a leading role in the production of data, evidence and knowledge around mobility in their own neighbourhoods, and at street level. The project will follow participatory citizen science methods to co-create and use innovative low cost, automated, road traffic counting sensors (i.e. Telraam) and multi-stakeholder engagement mechanisms in 5 pilots in Madrid, Ljubljana, Dublin, Cardiff and Leuven.