The New Virtual Reality: How Simulations Can Help Manage Mobility Systems
How simulations can help to manage mobility systems during and after the COVID-19 crisis, by Dr Stefan Seer and Dr Johannes Müller
However, there is a risk that once the restrictions are relaxed, infection rates will immediately start to rise again. Through simulation of people’s mobility behaviour, we can analyse the effects of access restrictions, one-way systems in stores and the relocation of sidewalks at the building and urban block scale as well as changes in mode-choice at the city scale.
Effective use of pedestrian simulations to maintain social distance in public spaces

An empty train carriage: how can we allow a safe usage of public places now and in the foreseeable future with less restrictions?
The current effects of COVID-19 restrict our personal freedom of movement almost everywhere in the world. Following the imperative to slow down the spread of COVID-19 as much as possible, the open burning question for all of us is: how can we allow a safe usage of public places now and in the foreseeable future with less restrictions?
We can observe that many public spaces, such as transport infrastructures (train stations, subway stations, trains, etc.) or essential shops of local supply (supermarkets, drugstores, pharmacies, etc.) are not built to maintain social distance, for example, due to narrow passageways or sidewalks. Since changing the physical design is often not feasible, the great potential lies in the optimal use of our buildings and public spaces, which can be supported by appropriate measures.
The movement of people as individuals, in groups or even in crowds, is dynamic and it is therefore difficult to predict the implications of different measures. At the same time, the risk of "trial-and-error" is very high, especially in the perspective of COVID-19. Using AIT’s pedestrian simulation tool SIMULATE [1], we can predict and analyse the flow of people under various structural and organizational measures. This enables us to evaluate the effectiveness of measures which are implemented to ensure that minimum safety distances between people can be maintained.
For example, we were able to show in the microscopic simulation of customer flows in a supermarket that reducing the customer frequency by half together with a one-way system, instead of a random sequence of shelf visits, has a strongly positive effect on contact times (i.e. the time during which the distance between people is less than 1 metre). If no measures are taken, almost everybody is in contact with other people for more than three minutes. With measures in place, 62% of all customers are in contact for less than 10 seconds, 83% for less than 20 seconds and 90% for less than 30 seconds.
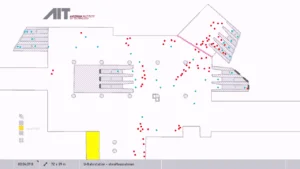
Figure 1a: Simulation of passenger flows in a metro station without measures.
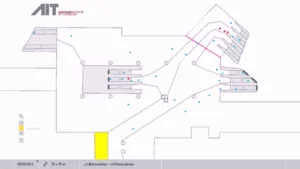
Figure 1b: Simulation of passenger flows in a metro station using measures to separate the flow of people (circles represent people; red circles show people whose distance to the next person is less than 1m).
We have also demonstrated similar positive effects on the reduction of contact times in the simulation for measures to manage and segregate the passenger flows in metro stations (see Figures 1a and b). By cleverly changing the access to platforms, the use of escalators and walkways when changing trains, the contact times of passengers can be greatly reduced. From an average of 50 seconds before to less than five seconds after implementing the measures (see Figures 2 a and b) without increasing transfer times in the station significantly. This confirms that pedestrian simulations can support the efficiency of current measures as well as examine and propose new strategies to enhance their effectiveness and reduce possible risks in case of gradual restoration of our daily activities.
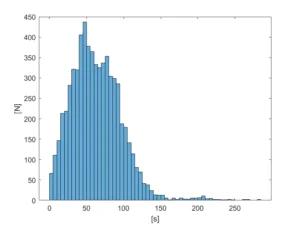
Figure 2a: Distribution of contact times (i.e. time during which the distance between persons is less than 1 meter) in the metro station without measures
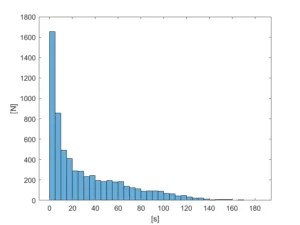
Figure 2b: Distribution of contact times (i.e. time during which the distance between persons is less than 1 meter) in the metro station using measures to separate the flow of people.
In the same way that microscopic simulations model pedestrian flows, macroscopic simulations model the traffic behaviour of people in the city. Undoubtedly, travel behaviour has also changed considerably during the lockdown period in the countries concerned [2]. Due to the closure of numerous facilities, many everyday routes have become obsolete. Google [3] has recently published data for all countries in the world on how much the number of visitors in certain places has decreased and the specific number of people who have visited public transit stations. In addition, TomTom [4] has published data on the reduced number of car trips in various European cities.
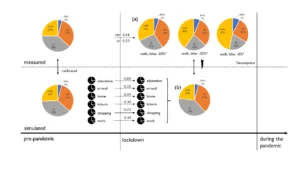
Figure 3: Scheme of the modal split estimations during the lockdown period based on (a) measured reduction in traffic, (b) measured reduction of frequency of visits for places assigned to an activity.
Clearly, the number of daily trips has decreased following a lockdown – but have people also changed their preferred mode of transportation? To answer this question, we applied a Multi-Agent-Transportation Simulation (MATSim) model for the city of Vienna, Austria that was originally calibrated to the multi-modal traffic of the pre-pandemic times. However, using recently published data from Google and TomTom from the lockdown period, two modal splits can be estimated. First, a new estimated modal split (Figure 3a) based on the measured values for public transit and car traffic that serves as the new baseline modal split. Since the number of daily trips per mode of transport is known in the model, we only need assumptions for pedestrian and bicycle traffic to obtain the lockdown modal split. The second model (Figure 3b), in comparison to the first baseline model, assumes that people have not changed their choice of transport. The traffic simulation reveals the respective modal split for each activity (ways to home, education, work, etc.). Since the reduction of activities is known, the new total modal split is obtained by this new weighting of activities. As it can be seen this modal split has strong similarities to the pre-pandemic one.
The comparison to the measured modal split (Figure 3a) shows, however, that even with the strongest assumed reduction in walks and bicycle rides, there has been a significant decrease in the use of public transport. The travel behaviour has shifted towards individual transport stronger than the model predicts (Figure 3b). While this does not appear to be a problem for the capacity of roads during lockdown, it will become more severe after lifting the restrictions again. Predicting the travel behaviour for the near future, especially after such an incomparable crisis, bears uncertainties that can be dealt with as soon as more data becomes available [5].
Regardless, the value of simulations at early stages to examine impacts of possible future scenarios is prevailing. If we consider car trips and public transport rides only and project the current mode choice to a fully unlocked country with the same total number of trips as in the pre-pandemic time, there would be 33.8% more car trips and public transport would only reach 91.2% of its former usage.
More detailed information on the changed mobility behaviour after the current COVID-19 restrictions can be collected through, for instance, movement trackers and travel diaries. Besides data on how people have changed their choice of transport for activities and their frequency of visits at locations, the change of distances travelled is important for more valid projections. If people choose locations for their activities in closer vicinity to their home than in the pre-pandemic time, walking and cycling become attractive alternative modes and can be specifically promoted through appropriate measures. Although the presented analysis of possible scenarios is rather assumption-intense at this point, the usefulness of macroscopic simulations to better understand ongoing phenomena could be demonstrated and can help during the decision-making regarding to upcoming changes.