Inside information
Sarah-Jayne Williams on how Ford Mobility is tackling our cities’ biggest challenges using vehicle journey data
Every day, millions of people face mobility challenges in cities all over the world. And, as the number of people living in our cities increases, so do the challenges.
The question is, how can data be used to tackle some of these challenges? And can it help improve the quality of life for everyone living and working in our urban environments?
To help find the answer, Ford Mobility spent the last year recording and analysing more than 1 million kilometres’ worth of vehicle and driver behaviour data in and around London to establish how data could address the concerns of transport authorities, as well as those of the capital’s businesses and residents.
The insights were encouraging: from pinpointing the optimal locations for EV charging points to proactively identifying likely road safety hotspots, the potential for the analysis has a far broader reach than London alone.
”We believe that data is one of the most crucial drivers for advancing urban mobility innovations as we plan our future cities. It is the invisible infrastructure behind new possibilities”
LONDON UNDER THE MICROSCOPE
With a population of almost 9 million people, London is the largest city in Western Europe by far. By collecting data from the city’s vehicles, we were able to gain a wealth of invaluable insights that could help improve mobility for everyone.
With the consent of participants, we fitted 160 connected vans with onboard computers to record journey data. Location, acceleration, braking, even whether the hazard lights were on – our simple plugin devices monitored and recorded everything. This generated more than 500 million data points, from more than 15,000 days of vehicle use, that was sent to the cloud for analysis.
The vehicles we selected were Ford Transit vans from a variety of sectors, from owner operators to larger fleets. Alongside the commercial vehicles, we also collected data from a fleet of private-use Ford Fiesta cars engaged on a year-long project to better understand driver behaviour.
The insights we found broadly fall into five main categories – areas where we feel data could potentially make a difference:
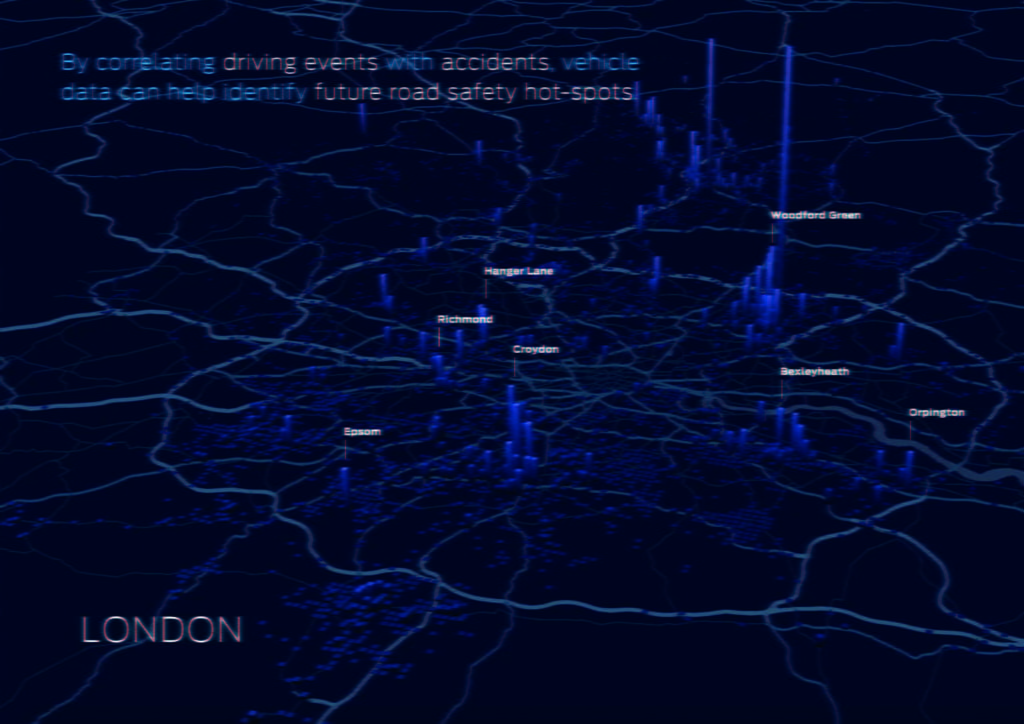
IDENTIFYING ROAD SAFETY HOTSPOTS
Our data enabled us to create a powerful algorithm – based on vehicle behaviour and historic accident reports – that has the potential to identify where road incidents may occur in the future. In London, 93 per cent of all collisions on the road are caused by human error, perhaps through travelling too quickly, distracted driving or failing to comply with the laws of the road.
By cross-referencing our vehicle behaviour data with readily available accident reports, we were able to create a dashboard that allowed users to drill down and identify likely road safety hotspots.
This methodology gives us the potential to help authorities proactively investigate high-risk roads and junctions most likely to be the scene of future traffic incidents. This could empower city planners to re-design safer streets for their communities. Drivers could benefit from this information too, potentially helping them avoid risky areas at certain times.
ELECTRIC VEHICLE CHARGING POINT PLACEMENT
There are now more than a million electric cars in Europe and it is expected that, worldwide, electric vehicles will account for the majority of all new car sales and a third of all fleets by 2040.
Yet, for many people and businesses, when it comes to switching to a fully electric vehicle, there is a concern that charging stations will not be there when they are needed.
By understanding where vehicles travelled, where they parked and for how long, we were able to identify ways in which charging could be integrated within regular journeys, especially for businesses whose drivers might make multiple stops, for example, to make deliveries.
Our insight suggests that, in London, productivity could be significantly improved with only a relatively small number of additional strategically positioned rapid charging stations.
It is an approach that we envisage could be extended to further cities, with data coming from connected vehicles, enabling those cities to more effectively plan how to spend their infrastructure budget.
Strategically located charging points could encourage adoption of electric vehicles and benefit both businesses and individuals as they spend less time hunting for places to top up their vehicle, reducing congestion and wasted time and energy.
RETIMING TRAFFIC
London is a 24-hour city. Yet rush-hour traffic costs businesses and individuals vast amounts of time and money every year. It’s estimated that direct and indirect costs attributed to congestion across the capital result in an annual loss of e9.5 billion (€11 billion) .
We wanted to see if we could use the capital’s roads around the clock to reduce the social and economic impacts of peak-period traffic.
Our analysis shows that by setting out two hours earlier, one of our test fleets of vans could save up to 30 hours in a typical week. That’s time currently wasted in traffic. What’s more, by time-shifting groups of users, such as commercial vehicles, other drivers may benefit from less congestion on the road.
If commercial drivers could set out an additional 30 minutes earlier, the time saved doubles. That means that by beginning their rounds twoand-a-half hours earlier, a fleet of drivers can potentially reduce their time in traffic by up to 60 hours per week.
There may be trade-offs for consumers or business owners: deliveries arriving earlier or later in the day, for example. But understanding the potential benefits and efficiencies of time-shifting could be helpful to encourage businesses and individuals to embrace the concept.
"Understanding the potential benefits and efficiencies of timeshifting could be helpful to encourage businesses and individuals to embrace the concept"
"We identified that around a fifth of the driven journeys around London in this study could have been faster if they’d used public transport instead"
MODE SHIFTING
Mode shifting – changing journeys from one type of transport to another – is central to the Mayor of London’s Transport Strategy and key to improving the capital’s road network issues.
We wanted to identify which journeys could be quicker by “shifting mode” from private transport to public transport, as well as to bicycle or walking.
To do this, we charted driven journeys across a fleet of privately owned Ford Fiestas. We then compared this to real-world public transport timetables. The web application we created clearly shows which driven journeys would have been faster if taken by public transport. It also identifies areas of London that are still generally quicker by car.
Overall, we identified that around a fifth of the driven journeys around London in this study could have been faster if they’d used public transport instead.
Tools like this could help city authorities optimise investment in future public transport infrastructure, enabling them to better target funding towards specific districts or transport modes. They could also be used to give targeted feedback to road users, showing the time benefits of using public transport instead of private vehicles.
SUMMER HOLIDAY EFFECT
It might stand to reason that roads are quieter during the summer: longer days, closed schools, the holiday season at its peak. Yet our analysis shows this isn’t necessarily the case.
There are difficulties with existing metrics for measuring congestion and traffic performance. So, we set out to create a new holistic baseline for measuring traffic performance using vehicle data to compare speed limits with the actual speeds travelled.
We combined these with mapping data, broke them down by time and road type, and compared traffic flow during school holidays against those during term time.
While some roads around schools clearly benefited from the “summer holiday effect”, others suffered: during the morning peak, a stretch of motorway by London’s Heathrow Airport witnessed a substantial slowdown – holidaymakers en route to sunnier destinations, perhaps? Some stretches in east London suffered slower traffic too, particularly along the A13 and A406 North Circular roads.
Road users over lunchtime generally experienced faster traffic flow. But performance could be erratic, with some areas slowing down instead of speeding up. It could be that faster speeds in some segments caused slowdowns in others, resulting in increased overall variability in traffic flow. What our detailed vehicle data has allowed us to do is offer improved insights into traffic flow during different times of the day – and of the year – which could be of help to transport planners.
THE JOURNEY BEGINS
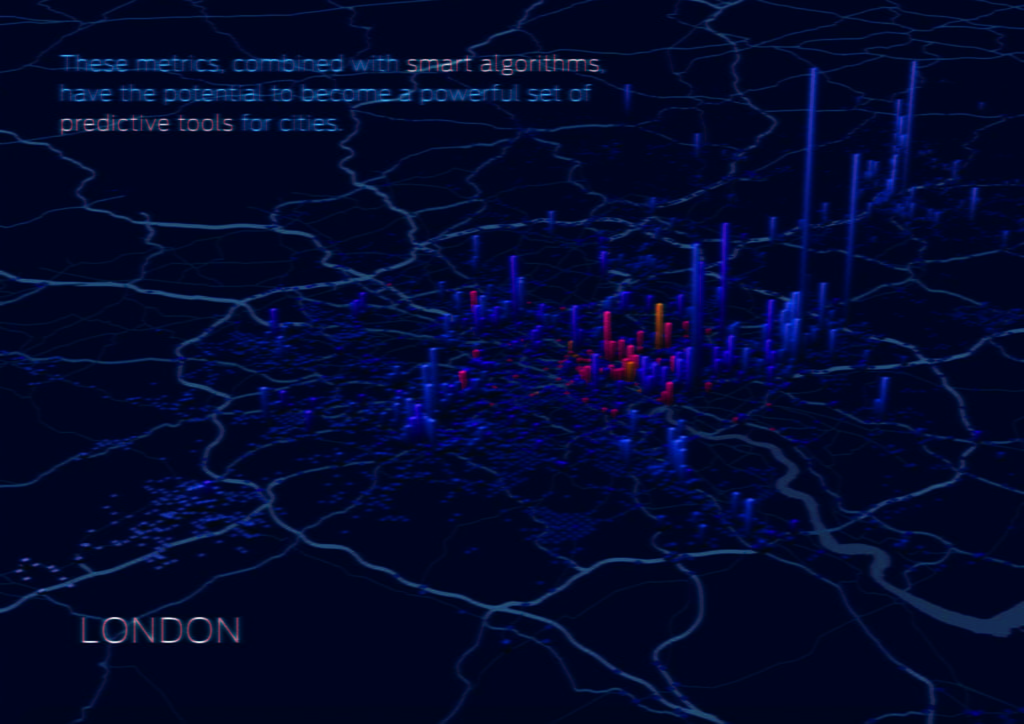
As we’ve seen, granular vehicle data, enriched with complementary data sets, has the power to provide real insights into how our cities move. We’ve learned a lot from a relatively small number of vehicles.
With connected vehicle numbers increasing in the future, we believe this data will be invaluable, opening up a whole new world of possibilities to make our cities more liveable. Through the power of data, we can help authorities to monitor and understand their cities much better, and consequently to optimise journeys for both citizens and businesses.
London is just one example of where Ford has been working with cities to provide mobility analysis. In the US, Ford’s Global Data Insight and Analytics team is already collaborating with Pittsburgh, Pennsylvania, and Miami, Florida, to prepare dashboards, visualise data and provide actionable insights to address local challenges.